Period and Phase Shifts
The period of a trigonometric function is defined to be when the graph repeats itself.
In most cases, the period or cycle is shown from a starting point such as where x = 0 or perhaps from a max or min value, but that's not required.

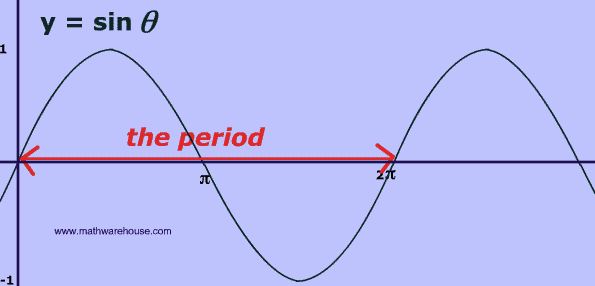
Period starting at the origin (0,0)

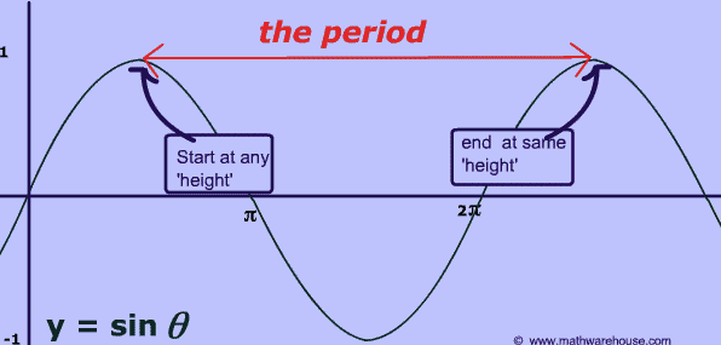
Period starting at a seemingly arbitrary (x,y) location on the graph.
The standard period of a purely sinusoidal function (Sine and Cosine) is pretty easy to identify as being 2 pi.

The period of Tangent and Cotangent is also pretty easy to identify, but whether or not these are purely sinusoidal functions is not set in stone. Some say Yes because they repeat. Some say No because the functions are not continuous because of the vertical asymptotes.
That being said, Tangent and Cotangent do repeat, so their period can be identified.


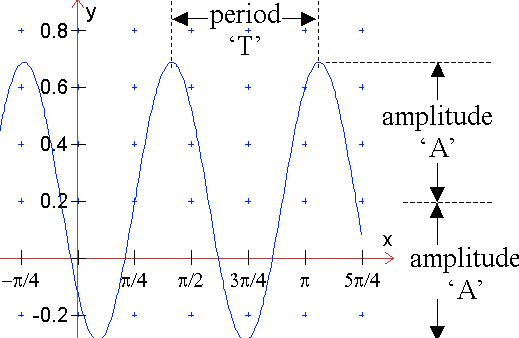
Identifying the Period visually is nothing more than determining how long it takes for a graph to repeat itself.


|

|
Identifying the period of a function graphically is pretty easy.


Calculating the period of a function graphically is so easy, we rarely see those types of problems. Instead, we end up having to solve them algebraically.

Find the Amplitude and Period of each of the following functions:


Calculating the Period algebraically requires a few steps.

|
Identify the normal period of your function. For Sine and Cosine it is 2 pi. For Tangent and Cotangent, it is pi. |


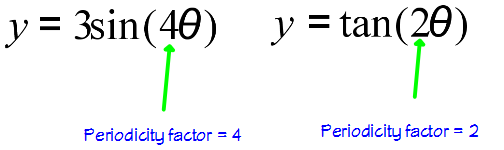
Identify the Periodicity factor in your function definition. The Periodicity value is often defined as the 'B' value.
It is the multiplier inside the parenthesis of the Trig function and right in front of the angle.
It is the multiplier inside the parenthesis of the Trig function and right in front of the angle.

Examples:

|
Step 3 is to apply the following formula to calculate the periodicity:
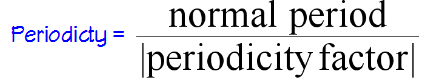
**Note** - the term 'normal period' above refers to the
normal period of your function. For Sine and Cosine it is 2 pi. For Tangent and Cotangent, it is pi, |


|
The normal period of tangent is pi. The periodicity factor is 2.
Therefore, the period of this function is pi/2. |

|
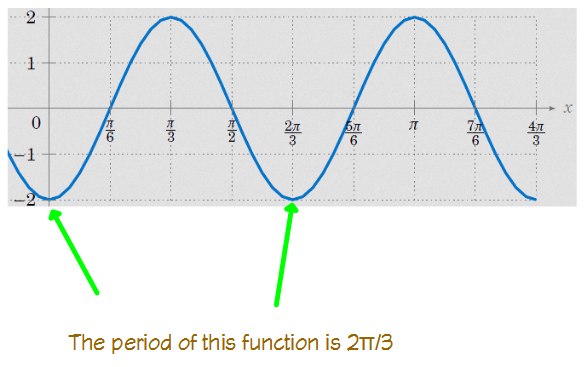
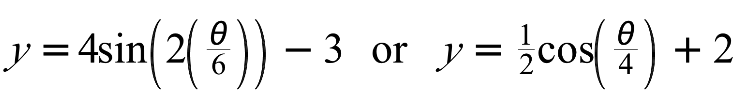
The normal period of sine is 2 pi. The periodicity factor is 4.
Therefore, the period of this function is 2pi/4 = pi/2. Note: The '3' in this function is the Amplitude. |
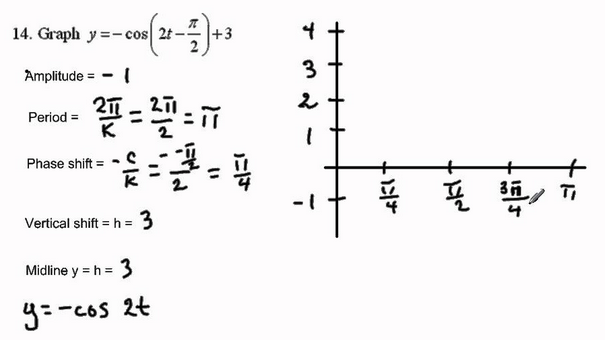
Once you have identified things in your function, such as Amplitude, Period, and Vertical Shift and you have to graph it.....

|

|
It's important to understand that the Amplitude, Period, and Vertical Shift does not fundamentally change the basic function.
If you are working with a Sine wave, it will still start at the origin (0,0).


If you are working with a Cosine wave, it will start at (0,1).


If you are working with Tangent, it will start at -pi/2.


| homework_13.pdf |
| homework_14.pdf |


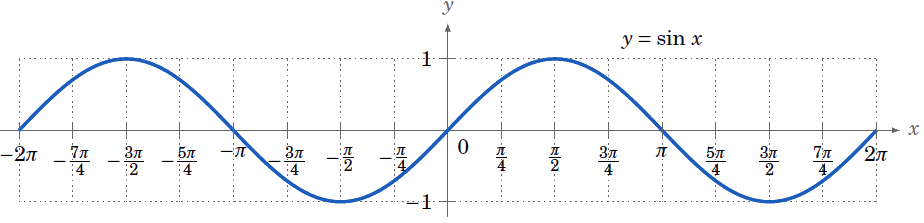
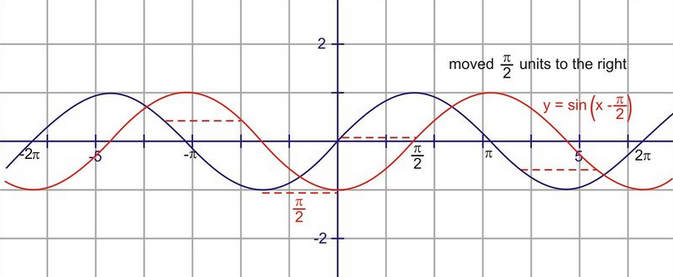
Consider the following diagram. It's not too difficult to notice that Sin and Cosine are pretty closely related to each other.
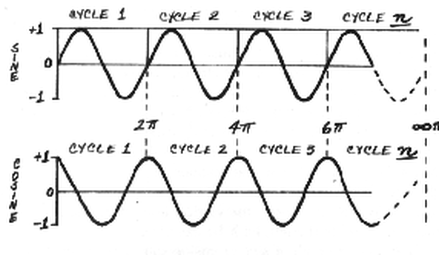
In fact, if we overlay the two functions, we get the following:
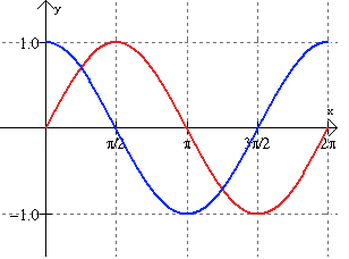
The functions are identical, they're just shifted sideways a little. This sideways shifting is known as 'Phase Shift'.


Phase Shift is the amount that a curve is shifted left or right from its normal position.
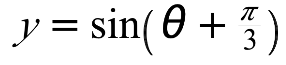
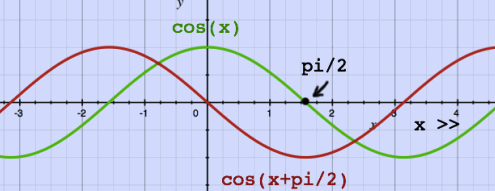
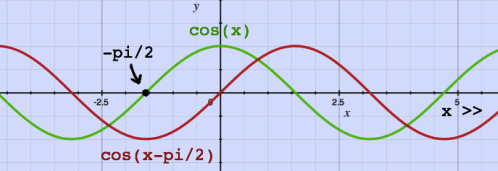
The Phase Shift will be to the Left if the value is negative:
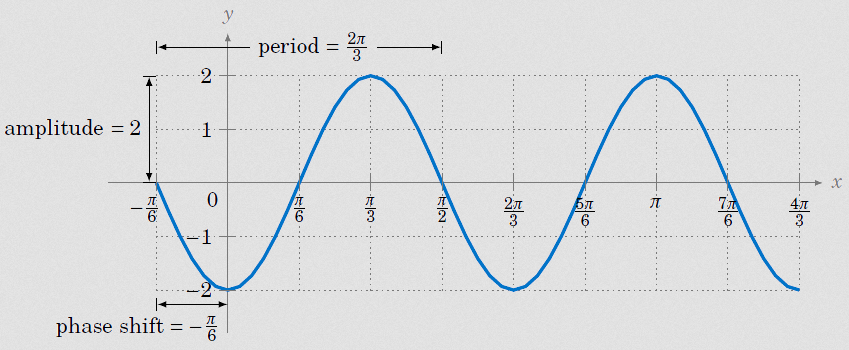
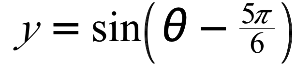
The Phase Shift will be to the Right if the value is positive:


When we have something like:
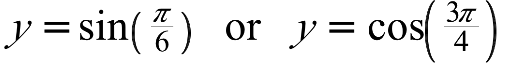
those functions 'start' in the right place. Sine starts at the origin (0,0) and Cosine starts at (0,1).
The same is true for the following examples. Their amplitude, period, and vertical shift is modified, but they still 'start' in the right place:
However, the following two functions show an example of a horizontal phase shift:

Essentially, all we want to do is negate the effect of the phase shift to figure out where the function is supposed to start.
If you search the internet, you will see multiple formulas to accomplish this, but really all we need to do is solve the equation:
Bx + C = 0